Census 2020 Population Estimates Updated
The Census Bureau has updated its population estimates for 2020 with county level data. This means any projects that have had to rely on the 2019 estimates can now switch to the 2020 estimates.
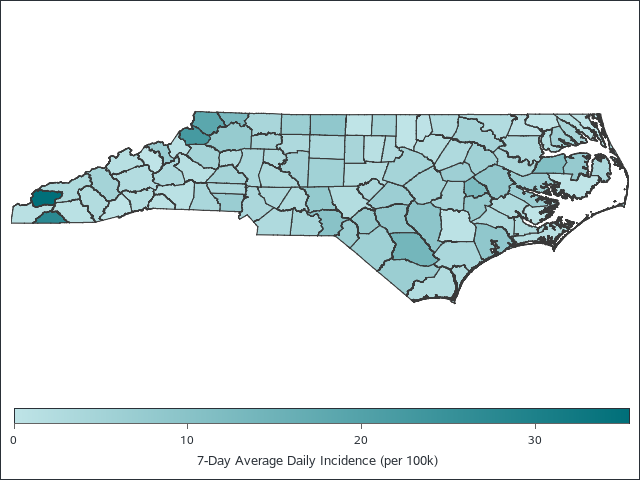
This is particularly useful for those of us who have been trying to track the development of COVID-19. The average incidence rates are typically rescaled to new cases per 100,000 people. Previous graphs and maps I have created used the 2019 estimates. I have now updated my code for mapping North Carolina developments to use the 2020 estimates.

Below this post is my code for loading the necessary data using SAS.
Note that I’m using a macro called mystate that can be set to the statecode abbreviation of your choice.
The conditional County ne 0 is in the code because the county level CSV includes both the county data as
well as the totals for each state.
filename popdat url 'https://www2.census.gov/programs-surveys/popest/datasets/2010-2020/counties/totals/co-est2020-alldata.csv';

data censusdata;
	infile POPDAT delimiter=',' MISSOVER DSD lrecl=32767 firstobs=2;
	informat SUMLEV REGION DIVISION State County best32.
                         STNAME $20. CTYNAME $35.
		CENSUS2010POP ESTIMATESBASE2010 POPESTIMATE2010-POPESTIMATE2020 best32.;
	format SUMLEV REGION DIVISION STATE best32. COUNTY 5. STNAME $20. CTYNAME $35.
		CENSUS2010POP ESTIMATESBASE2010 POPESTIMATE2010-POPESTIMATE2020
		COMMA12. StateCode $2.;
	input SUMLEV REGION DIVISION STATE COUNTY STNAME $ CTYNAME $
                        CENSUS2010POP ESTIMATESBASE2010
		POPESTIMATE2010-POPESTIMATE2020;

	if (State ne 0) and (State ne 72) then
		do;
			FIPS=put(State, Z2.);
			Statecode=fipstate(FIPS);

			if Statecode eq &mystate and County ne 0 then
				output;
		end;
	keep STNAME CTYNAME County FIPS Statecode Popestimate2020;
run;
The media release can be viewed here. The county-level data set can be downloaded at this page.