This post is a follow-up to my post on how to load data from Zillow. Housing prices have soared through the COVID-19 pandemic, leading to a lot of discussion about housing affordability. The quickly growing home values coupled with the subsequent raising of interest rates on mortgages are seeing more and more people priced out of the ability to purchase a home. While rent prices have increased as well, they haven’t increased as sharply as home prices.
In this post, I will look at the Zillow data set and consider a popular question for millennials - is it better to buy or rent in the current market? For this analysis, I will use the zip code level data of the Zillow Home Value Index (ZHVI) and the Zillow Observed Rent Index (ZORI) for North Carolina metropolitan areas in the years 2019 through June 2022. To evaluate the monthly costs of owning a home, I will utilize the 30 year fixed rate mortgage average from the FRED database, a comprehensive database aggregating various economic time series maintained by the St. Louis Federal Reserve.
Disclaimer: This post is not financial advice. We are only exploring some aggregate data sets. Past performance is not indicative of future performance.
Initial Thoughts
Both Zillow data sets are available with monthly data published at the zip code level. As such, they are equally well-spaced in time. One issue we notice at initial inspection is that the ZHVI observations are dated to the last day of every month, while the ZORI observations are dated to the first of the month. For merging and comparison, we will set the ZHVI to the first of the month.
Both data sets are available for download at the zip code level. The ZORI data set is much smaller, however. It covers 2,453 distinct zip codes compared to the ZHVI’s 27,366 distinct zip codes.
An initial graph of average ZHVI and ZORI for North Carolina shows the dramatic growth in home values and the degree to which rent is lagging behind. Both y-axes have been scaled proportionally.
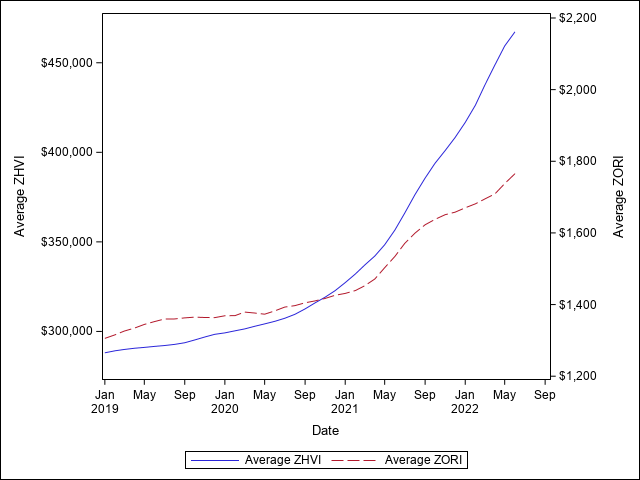
Average Zillow Home Value Index (ZHVI) and Zillow Observed Rent Index (ZORI) values for North Carolina. The left and right axes have been scaled proportionally.
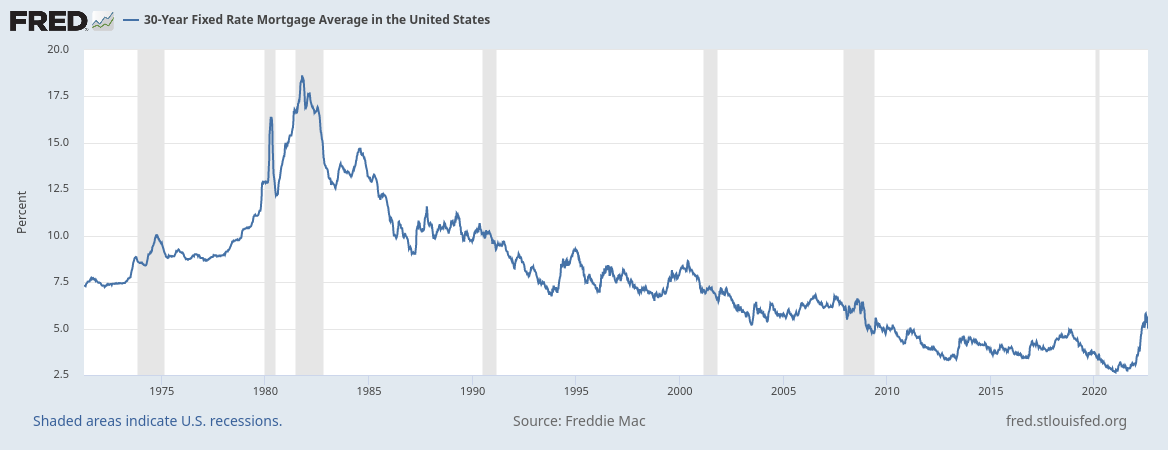
The FRED data set is published weekly on Thursdays and provides a seasonally unadjusted look at the average, actual mortgage rates that homebuyers have received throughout the US. So while this data set has the largest number of data points in time, it is the least granular on a geographic level. I don’t have detailed information about the geographic variability in mortgage rates and will ignore this for now. To allow merging with the Zillow data, the FRED data set will need to be averaged in some form. For this post, I will use simple averages by month. It is important to note that the FRED data is not in decimal notation. That means that 3.5% is written as 3.5 as opposed to 0.035.
One thing that is interesting about the FRED data is that it goes back as far as 1971. Looking at the overall historic values, we see that the past decade’s very low interest rates (less than 5%) are an anomaly.
Crafting a Mortgage-to-Rent Index
I will create two indices, one being a very naive implementation focusing just on the actual monthly payment on the mortgage loan and the monthly rent payments. This is followed by an improved index that takes into account additional monthly expenses. After both indices have been created, I will discuss some of their shortcomings.
A Naive Implementation
For monthly cost comparisons, we don’t actually care about the value of the home directly. What matters is the monthly mortgage cost. There is a lot of variability here and I will make the following assumptions:
- The mortgage originates in the month given by
Dateat the rate given by the monthly average of the Mortgage30US time series. - A 20% down payment was made, so that the mortgage amount is for 80% of the ZHVI. A 20% down payment is often recommended because it avoids the need for mortgage insurance, which would create an additional monthly expense.
- Closing costs are handled separately and not rolled into the mortgage.
Monthly mortgage payments can be calculated with the PMT function in SAS. The general syntax is PMT( rate, number-of-periods, principal-amount [, future-amount] [, type]). The rate is the APR divided by the number of periods in a year, in our case 12. The number of periods is 12 payments over 30 years, i.e. 360. The principal amount is 80% of ZHVI, while the future amount is zero (default value). SAS allows us to pick of we want to use end of period (type=0) or beginning of period (type=1) payments. For the monthly amount the difference is small, so I will use the default end of period scheme. With that, our formula for the monthly payment is PMT(M30Rate/12, 360, 0.8*ZHVI).
We can now construct a simple unit-less ratio of monthly mortgage costs over monthly rent. If this index is greater than 1, it is cheaper to rent while if it is less than 1 it is cheaper to purchase a home. Below is a figure demonstrating the distribution of this index in North Carolina for 2019 through June 2022.
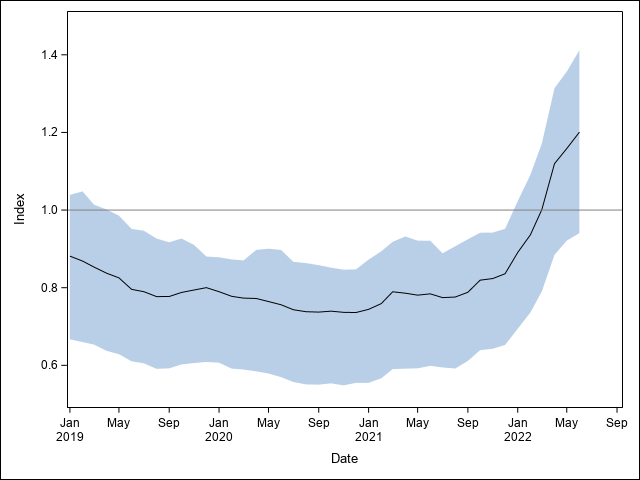
Mean index value for North Carolina. The shaded region represents the 25th through 75th percentile of index values. Note that the index is <1 until 2022, despite the sharp increase in ZHVI across the state seen above.
The index indicates that the situation was favorable to home buyers until 2022, when it flips to being generally favorable to renters. FRED data indicate that the average mortgage rate didn’t substantially begin growing until winter 2021. This lends credence to the view that historically low interest rates have helped buffer would-be homeowners from increases in home value.
Individual zip codes’ index values behave similar in pattern to the the figure above, making it a good approximation to observed behavior.
A Slightly Better Implementation
The previous implementation underestimates the true monthly cost of home ownership. For one, homeowners are required to pay property taxes each year. While an individual doesn’t directly pay the local government on a monthly basis, funds for this purpose are typically collected in an escrow account so it is an ongoing cost. Property tax rates are set at the county and municipal levels and mapping them directly to the ZIP codes requires some work. The rates themselves are fixed fees for every $100 of assessed home value. For the purpose of taxation, the home value used is not the ZHVI, but the value assigned to the home by the county. In North Carolina these assessments must take place at least once every 8 years, but individual counties may choose to do more frequent assessments. As such, there can be a large discrepancy between the ZHVI and the assessed value. I have seen cases where the ZHVI is roughly double that of the county’s assessed value. Finding the average assessed value is easy for individual homes (Zillow displays it on its website), but finding an aggregate value that can be used for analysis is tricky. For ease of use I’ll assume that assessed value is 70% of ZHVI. I expect this measure to underestimate the assessed values of homes in 2019 but to be close to target in 2022.
Based on the most recent effective tax rates published by the North Carolina Department of Revenue, the average tax rate is approximately 1.02%, with a minimum of 0.33% and a maximum of 1.7%.
In addition to taxes, escrow accounts will typically collect monthly insurance fees as well. The two main types of insurance included are homeowners insurance and mortgage insurance. Mortgage insurance is mandatory when purchasing a home with less than a 20% down payment and protects the lender from the borrower defaulting on the loan repayment. In the above example we assumed a 20% down payment, so mortgage insurance would be optional.
The cost of homeowners insurance varies wildly as can be seen in this article from NerdWallet. Their calculated average monthly cost for North Carolina is $142. Renters may be required to purchase renters insurance, but this is not a requirement for all properties and the cost is substantially lower than homeowners insurance. NerdWallet’s analysis gives a monthly average cost of $12 for North Carolina.
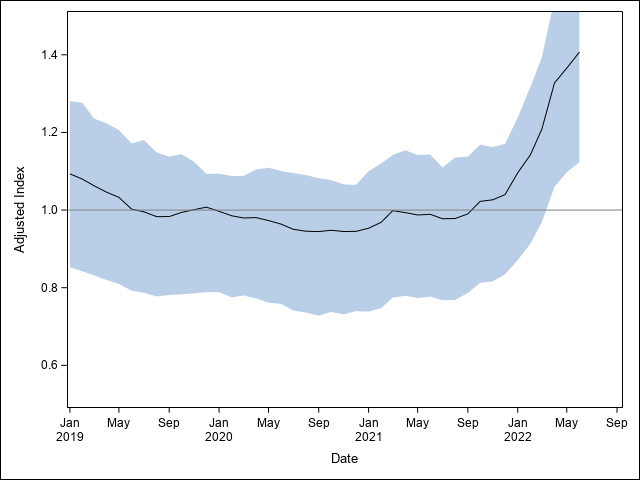
Mean adjusted index value for North Carolina. The shaded region represents the 25th through 75th percentile of index values.
As expected, the adjusted index shows the same overall behavior but is shifted up. This index gives a more complicated picture, in which the zip code starts mattering somewhat more in whether renting or buying is cheaper on a monthly basis.
Further Thoughts
The above analysis was relatively simple, but a good excuse to take a look at the data made available by Zillow. This is not the end of the story, however. I have made several simplifications here, although on average I would argue they were in favor of home purchases. There additional matters to consider, which I will take up below. We also only discussed aggregate data. Particular housing may offer other benefits, especially if you have knowledge of some likely future events. For example, a large tech company planning to move to an area tends to increase both rent and housing prices, so purchasing now may be beneficial by locking in today’s prices. We also haven’t considered whether there are differences in housing stock and location that may outweigh purely financial considerations.
Risk and Other Costs
Another item to consider is the question of risk in either scenario. A homeowner incurs somewhat larger risks of on-going expenses that we have conveniently ignored. Roofs, HVAC systems, etc. need maintenance and eventually will need to be repaired. Neither last forever either, so they will each need to be replaced at least once, if not more often, during the 30 years the house is being paid down. A majority of new construction and a large number of existing homes are part of a Home Owners Association (HOA). Being part of an HOA not only increases monthly cost due to HOA fees, but also exposes a homeowner to the risk of special assessments. These are one-time financial obligations on homeowners to cover some expense for the HOA.
While a renter may be immune to costs such as these, they are not immune to changing rent prices. By having a fixed-rate mortgage on the other hand, monthly housing expenses stay locked at current rates. Furthermore, while rent is not tax deductible, mortgage interest is. Under current guidelines, up to 750,000 USD in mortgage interest on your primary home can be deducted from your income tax. This is especially valuable during the first 15 years of the loan, when interest accounts for the majority of the mortgage payment.
Housing as an Investment
One issue that we have ignored so far is the idea of home purchases as investments. Home prices have historically increased. Each year lived and mortgage paid on a property increases your share in the home’s value, otherwise known as equity. Some would argue that even if the monthly cost of homeownership is in excess of the cost of renting an equivalent home, it’s worth it in the long run as an investment in your financial future. Proponents may point to homeownership being a key component in long term wealth accrual.
Assessing the value of equity growth in wealth building needs to be viewed in opposition to investing the potential price differential. We are only talking about the difference in housing cost being utilized here, not in using additional funds to pay down a mortgage early. This has not been an effective strategy for nearly 30 years.1 The S&P 500’s average annual return during the period of 1975-2021 has been 10.2%. Home values on the other hand increased annually by an average of only 4.5% between 1975 and today.2 This would indicate investment in the S&P 500 would be expected to outperform real estate investment for the average person over the long run.
The variability of the two is rather different, however. For comparison, we can show a distribution of annual returns from the S&P 500 compared to FRED’s All-Transactions House Price Index.3
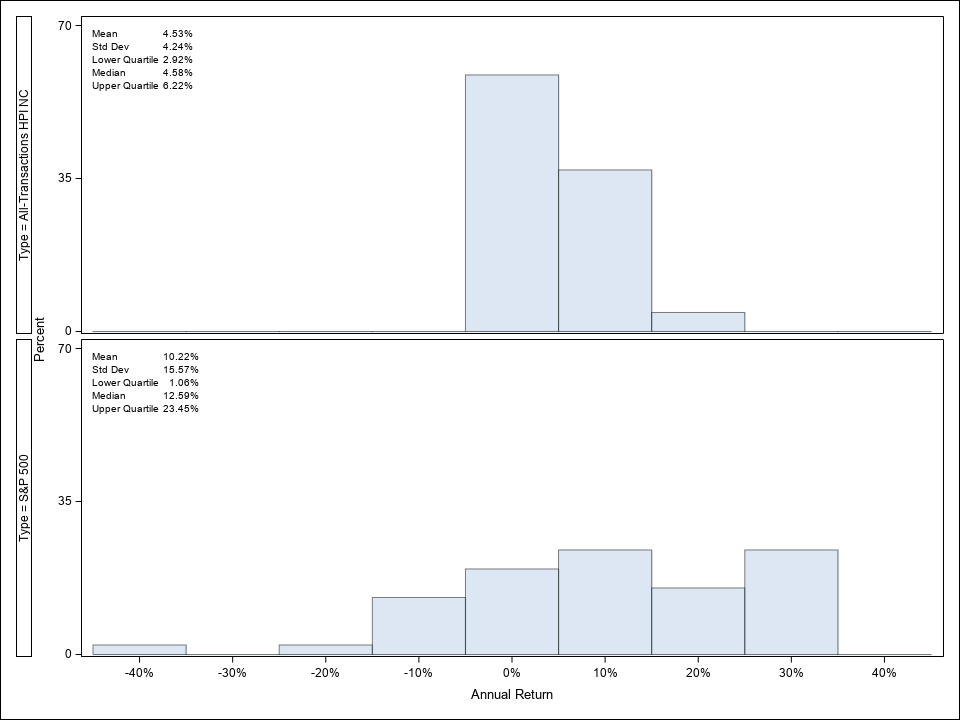
Histograms showing the distribution of annual returns of the All-Transactions House Price Index for North Carolina and the S&P 500 for 1976-2021.
While this shows that we can expect greater payoff from stock market investments compared to real estate, this is not helpful if we have to pay for housing and don’t have excess funds to throw at the stock market. If the actual monthly cost of homeownership and rent are about equal and max out our available funds, then purchasing a home builds at least some equity, no matter how small, compared to no investment being made. Only when rent is lower than mortgage costs and fees does it make sense to start comparing rates of return.
We should never underestimate the power of compounding, however. Consider the following example: you have the option of purchasing a 400,000 USD home with a 80,000 USD (20%) down payment at 5% interest as a 30 year fixed rate mortgage. Assume no other costs. In total, this housing purchase will cost you approximately 698,000 USD over the course of 30 years. Assuming 4.53% annual increase in housing value, this leaves you with about 1,553,000 USD in equity at the end. Given your total cost you have made a profit of approximately 855,000 USD. Now compare this to stock market returns, assuming the 10.22% annual growth we found above. Investing the down payment only, with no further payments made, would leave you with approximately 1,695,000 USD after 30 years. To match the amount of equity in our example home after 30 years would require only a 73,500 USD in initial investment. If we only wanted to match the profit of about 855,000 USD with a one-time investment, we would require an initial investment of approximately 42,500 USD.
Despite these superior returns from investment, we still need to live somewhere. I have already mentioned that unlike a mortgage payment, rent is not fixed over the 30 year timespan. How much should I expect renting to cost me? Let’s assume we invest the entire down payment and rent a home that costs exactly the same as the mortgage would have cost. Assuming once annual increases in rent of 4.17%, we spend a total of nearly 1,190,000 USD on rent over the course of 30 years. Given these expenses, the profit from investing the 80,000 USD shrinks to a mere 500,000 USD.
This suggests a strategy of minimizing the down payment and investing the difference, if possible. One downside of this is that having a smaller down payment may lead to less favorable mortgage terms. In this second scenario, let’s assume that we make a 40,000 USD down payment on a 400,000 USD home with an increased, but still fixed, mortgage rate of 5.25% over 30 years coupled with a 40,000 USD initial investment in the S&P 500 at 10.22% increase annually with no additional investments made. Here we invest a total of approximately 766,000 USD into our home, reducing our profit on the home purchase to approximately 797,000 USD. But our initial 40,000 USD investment has accumulated to about 847,000 USD. This brings our total profit to approximately 1,644,000 USD in this scenario - nearly double the 855,000 USD profit in the 80,000 USD down payment scenario.
Last Thoughts
Overall, we see that the more precise we want to be, the more difficult it becomes to estimate an ideal strategy as there are a lot of moving pieces, not all of which can best be approximated by a geographic average value. Given the very different variability in housing value increase compared to stock market returns, it may make sense to generate a large number of random walks to get a better feel for the distribution of outcomes after 30 years. Finally, this entire post has assumed that we remain living in the same home for the entire 30 year life of the mortgage. Many will want to move at some point during their next thirty years, perhaps to make room for a larger family, to down-size, or to follow a job opportunity. This creates additional costs and considerations for deciding between renting and owning a home.
Average mortgage rates have been below average annual return of the S&P 500 since the 1990s. ↩︎
Annual returns of S&P 500 were calculated from data provided by Investopedia. Annual returns of housing prices were calculated from the All-Transactions House Price Index for North Carolina (FRED time series NCSTHPI). ↩︎
I have chosen this measure for historic house price increases as this index is available on a quarterly basis starting in 1975, unlike Zillow data which only goes back a little more than 20 years. Both US wide data (USSTHPI) and state specific data (e.g., for North Carolina: NCSTHPI) are available from FRED. I will use the North Carolina data set for my comparison. An alternative measure to consider is the median sales price of houses sold in the South census region, available on a quarterly basis starting in 1965 from FRED (MSPS). ↩︎