Most people can guess the current life expectancy for Americans at birth as being in the high 70s or around 80. In fact, given the current mortality table published by the Social Security Administration (SSA), males have a life expectancy of about 76 compared to a female life expectancy of about 81. Of course that is only an expected value. Guessing the distribution of a person’s life expectancy is somewhat more difficult. In this post, we’ll take a look at some simulated lives to get a feel for the distribution of life expectancy and its implications for retirement planning.
Let’s begin by looking at our mortality table. The rows indicate an individual’s current age. For both a male and a female, three values are then given: the probability of death in a given year, the “Number of Lives”, and the life expectancy for this individual. The probability of death in a given year is somewhat self-explanatory. The “Number of Lives” variable starts with 100,000 individuals and gives the number of survivors at a given age. So for example, of the 100,000 males “born” at age 0, we expect 99,392 to be alive at age 1. The life expectancy is the expected number of years of life remaining for an individual. We can start by plotting this to get a feel for the data.
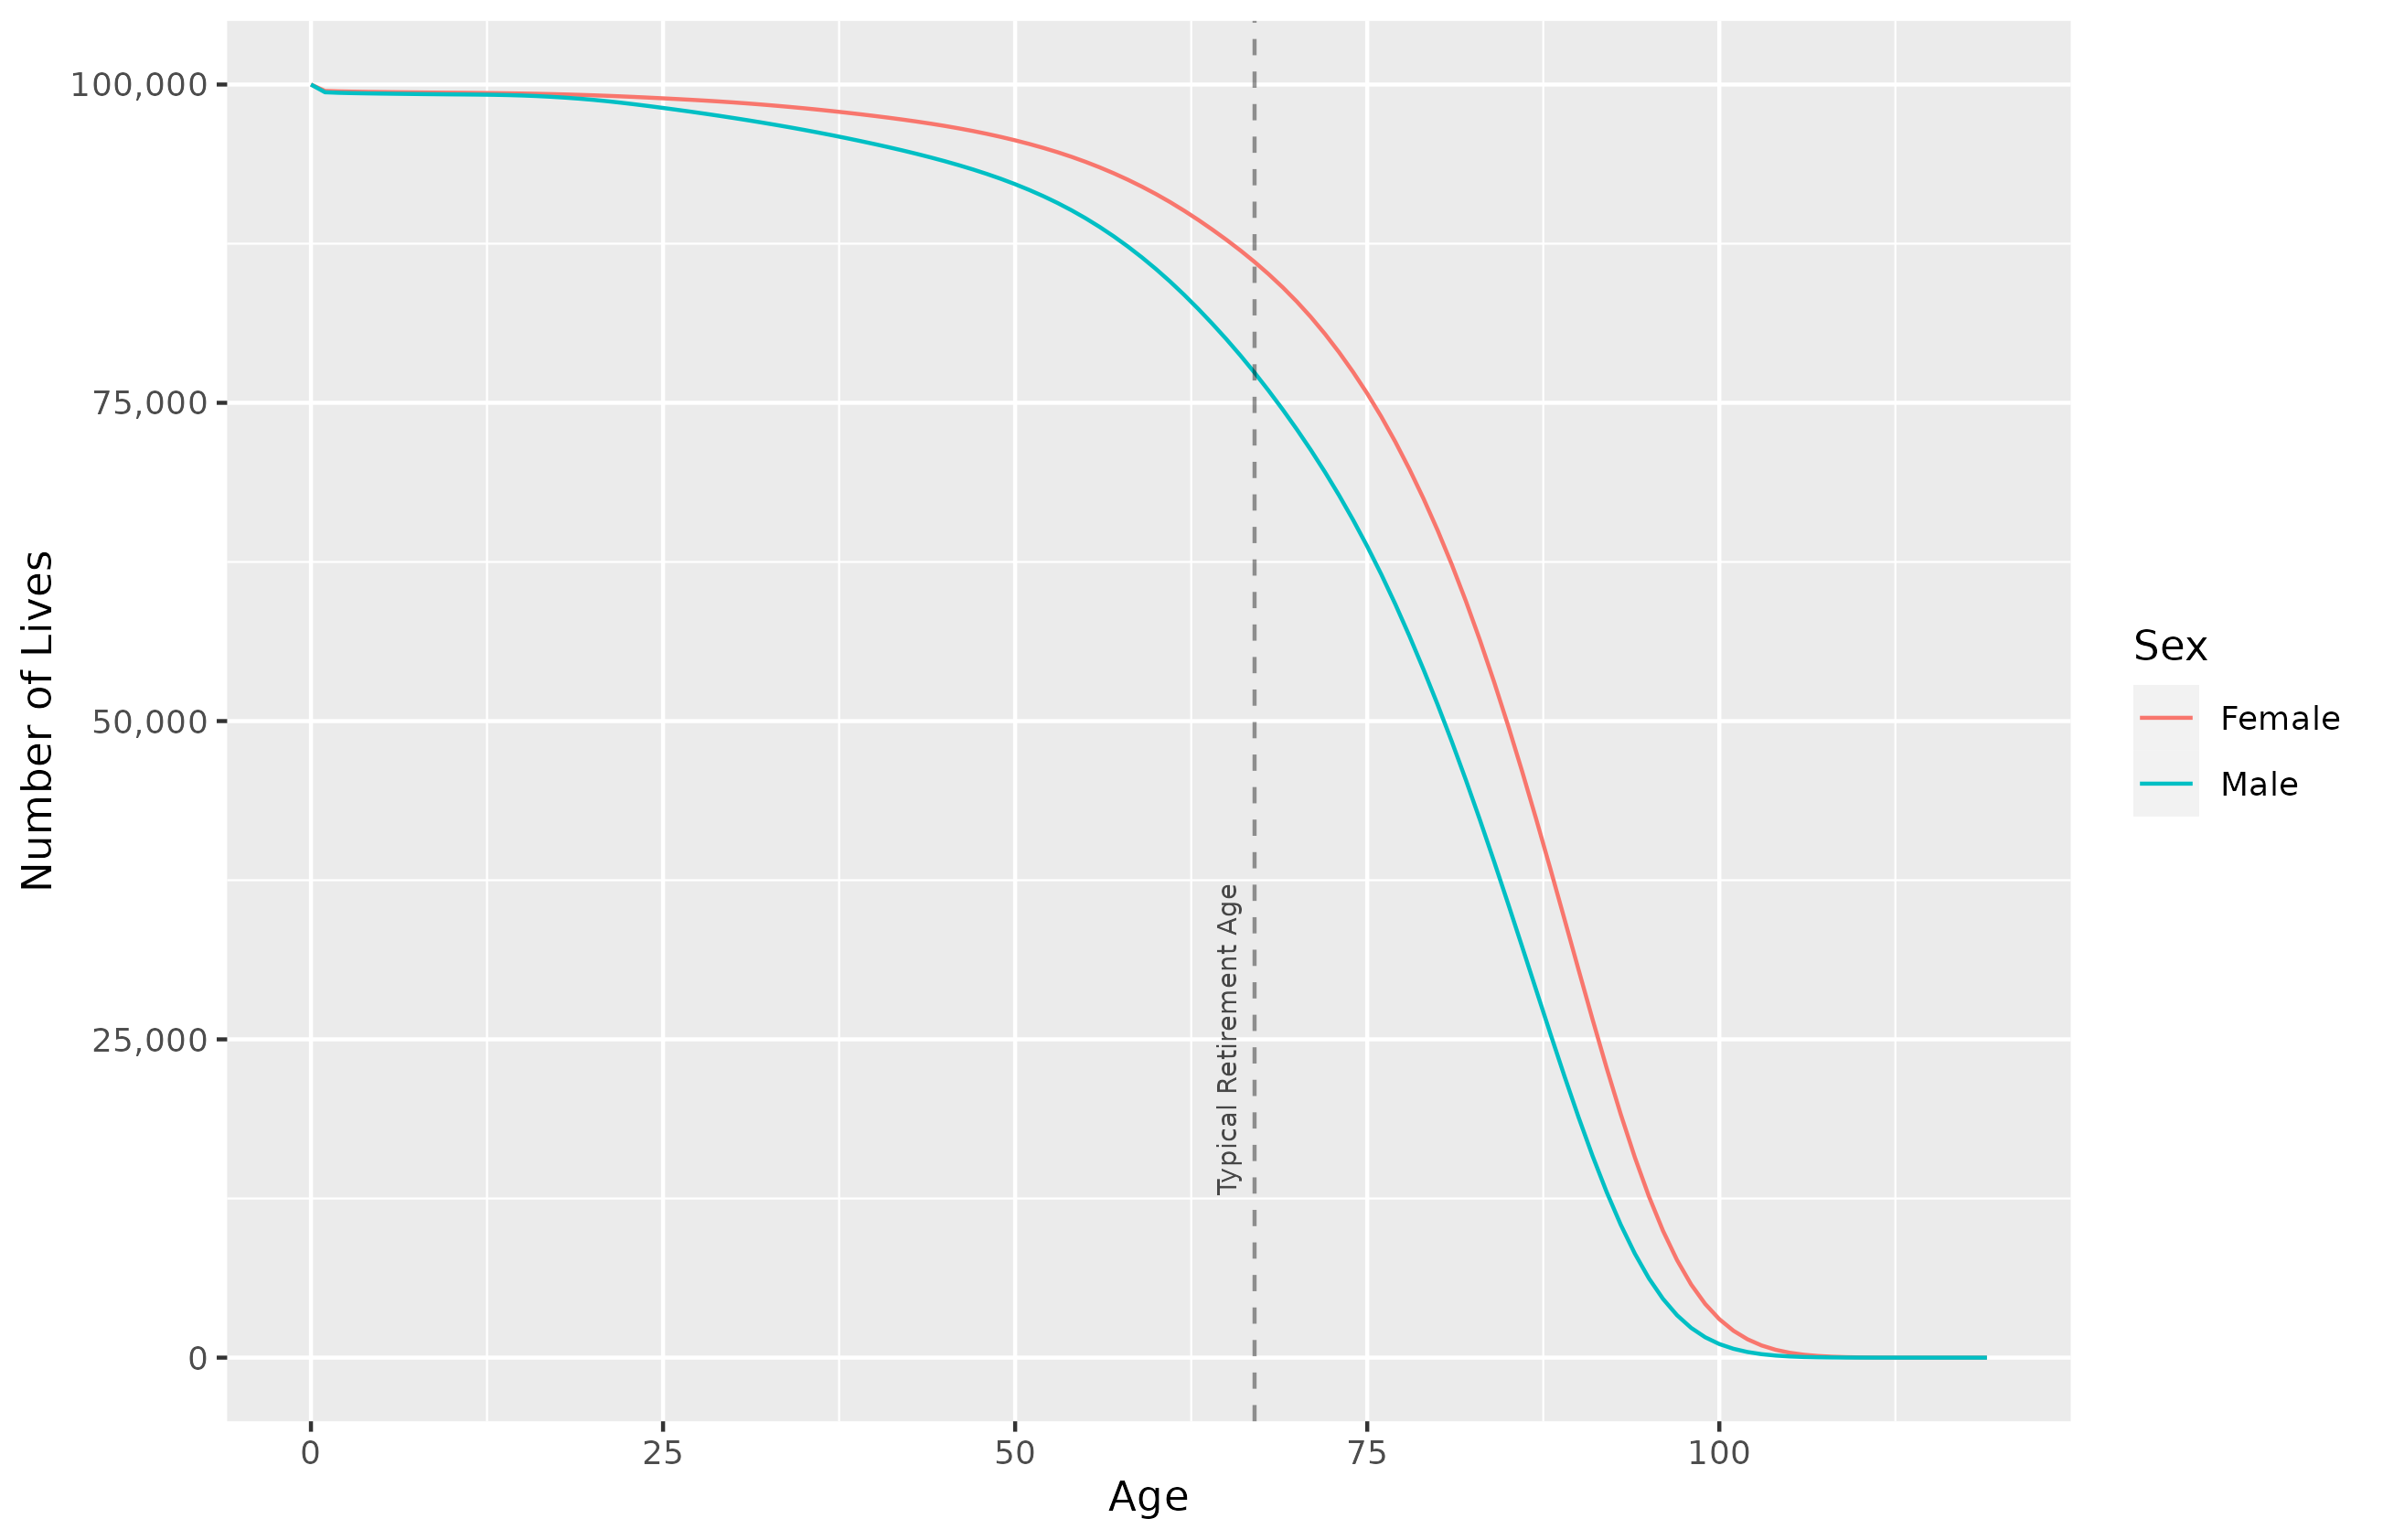
Survival curve for 100,000 males and females given the 2019 SSA mortality tables. The dashed line indicates the typical retirement age of 67.
To get a feeling for the distribution of age at death, I ran 10,000 simulations each for males and females starting at ages 0, 25, 40, 60, and 80. These ages were chosen to represent the full range of possibilities at birth, followed by early, mid- and late career individuals. Age 80 was included for comparison as an older retiree value. Since the probability of death by age 50 is so low, we expect very little difference for the first three ages, with differences becoming more pronounced as age progresses, but it is still useful to visualize.
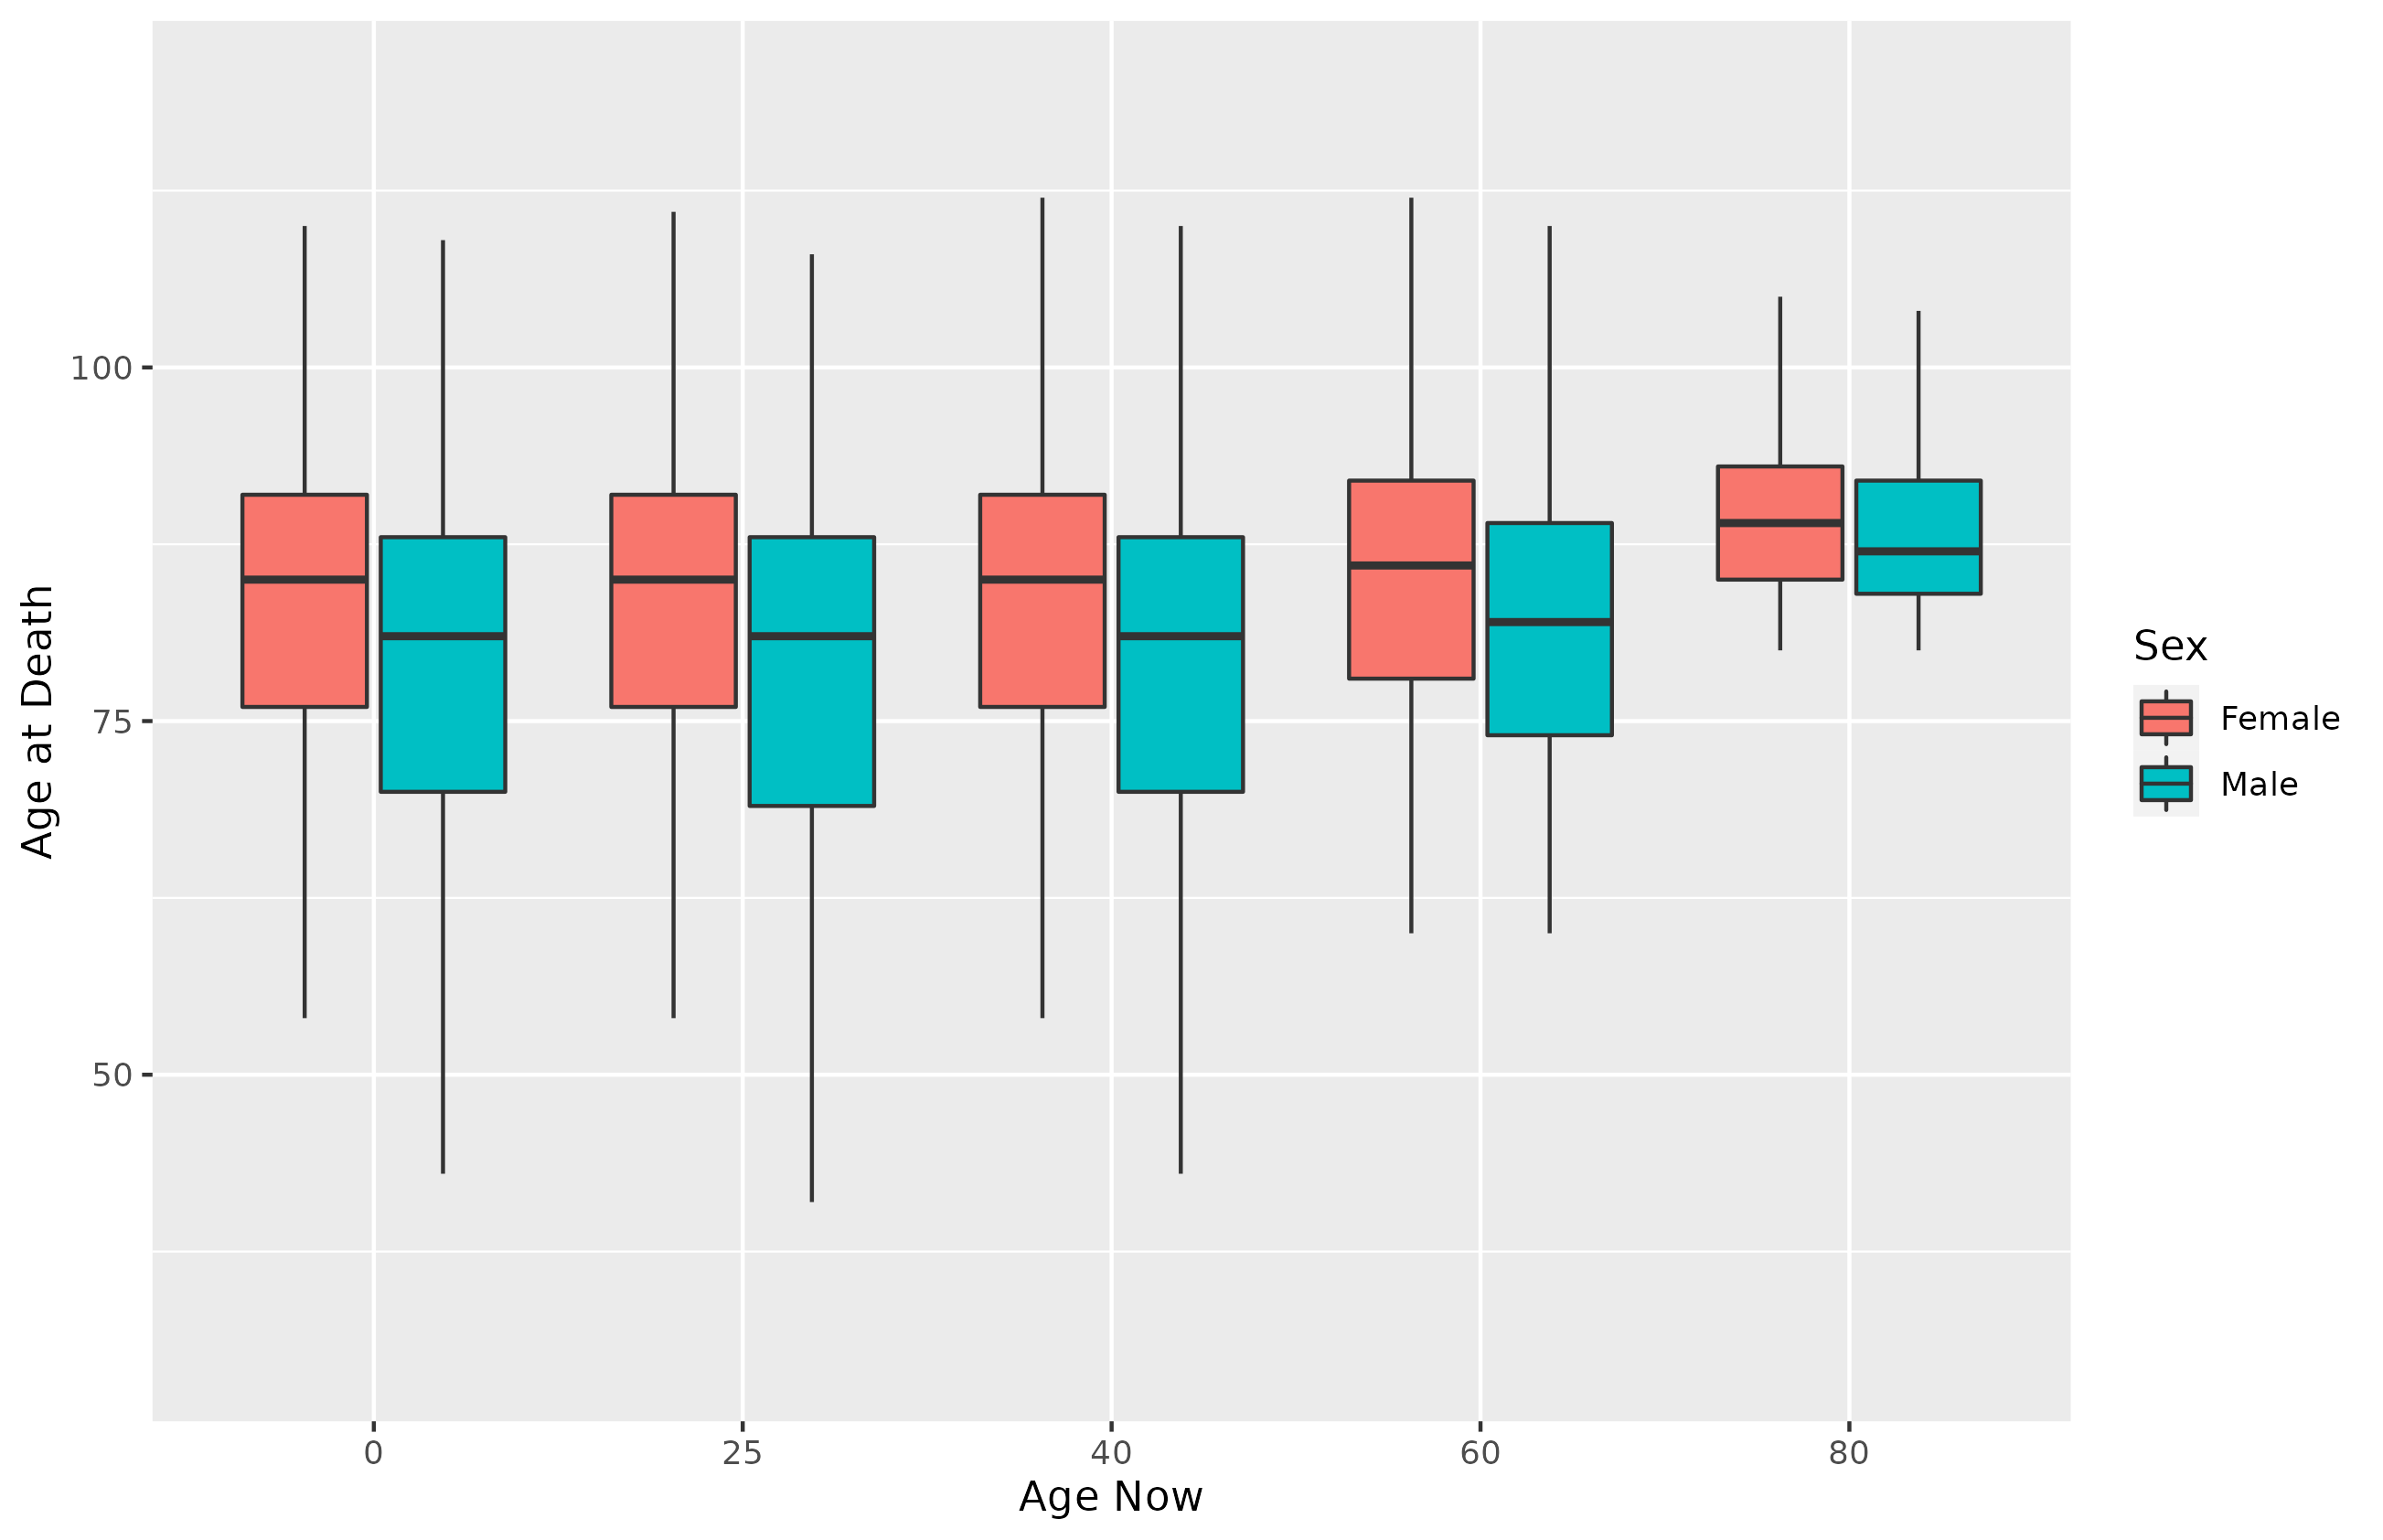
Overview of the distribution of age at death by sex for different ages at the beginning of the simulation. Outliers are are not represented. Note how the results for ages 0 to 40 are nearly indistinguishable.
As expected, we see relatively little variation between birth and age 40, with some recognizable changes beginning at age 60. Given that, I will visualize the distribution for an individual starting at age 40. A 40 year old is about 25-30 years away from retirement and has probably at least started thinking about saving and how much they’ll need to put away to last through retirement.
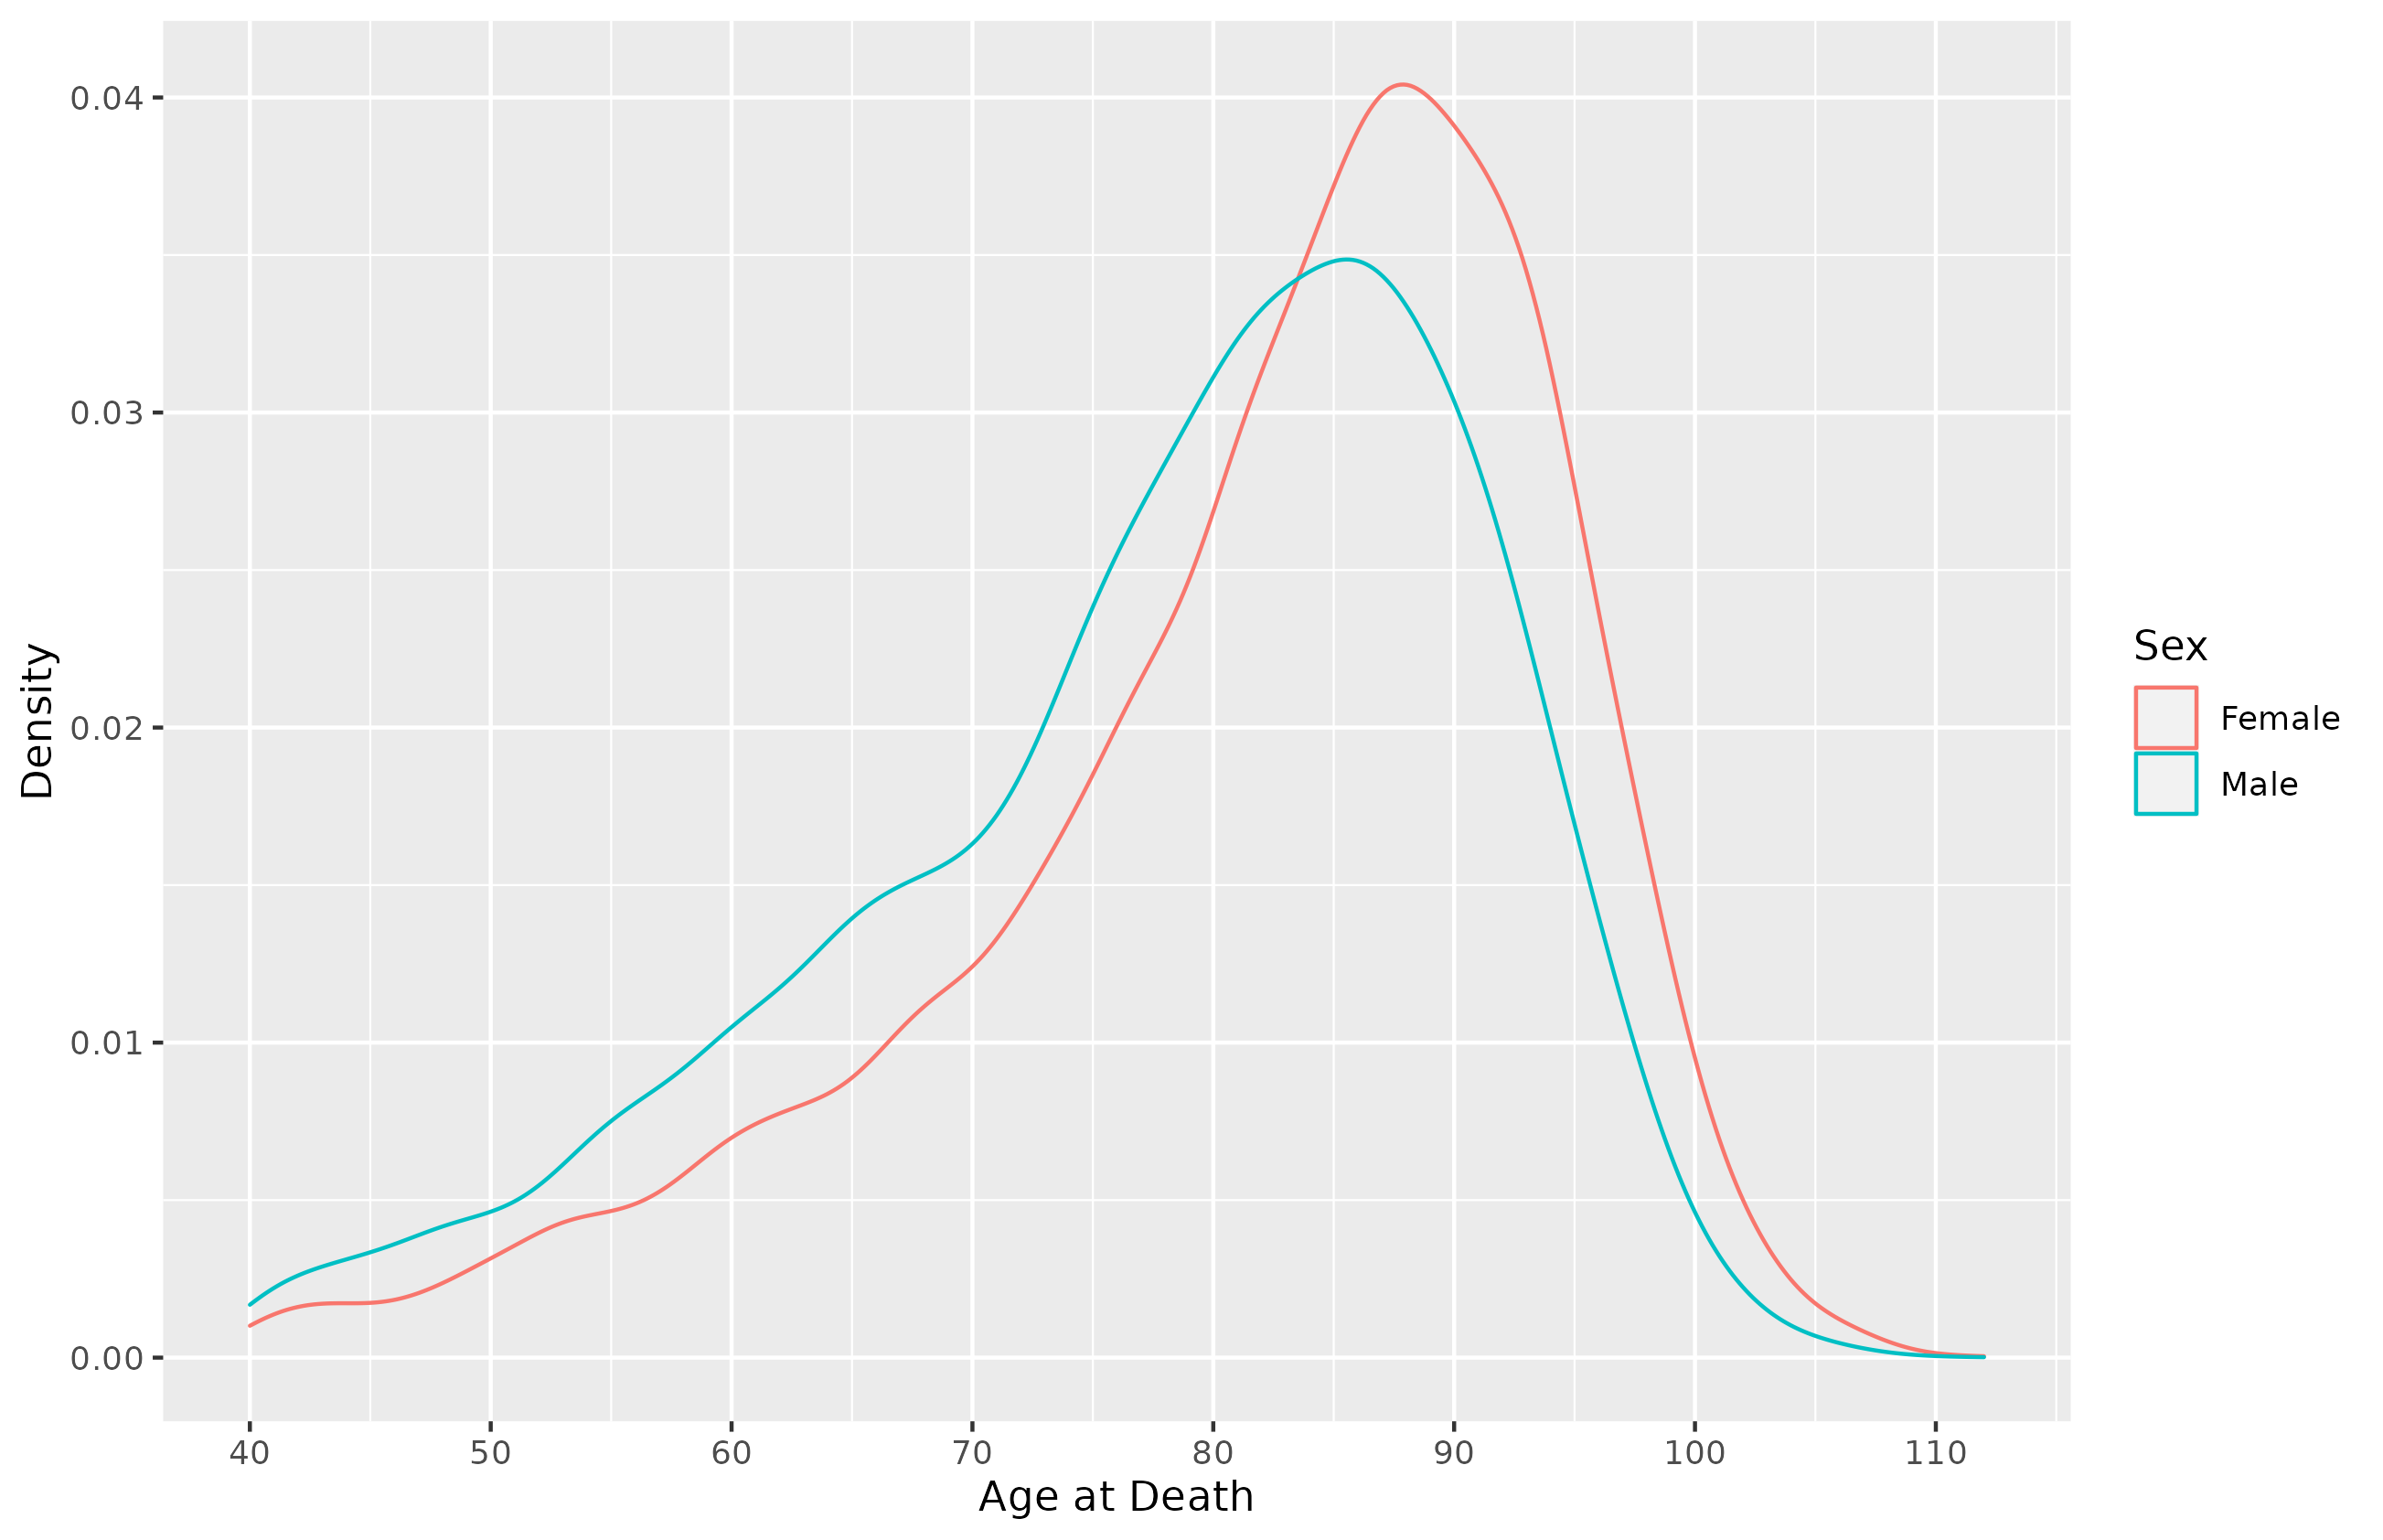
Distribution of age at death for males and females given a starting age of 40. Half of the starting population is expected to make it to at least 81/85 (Male/Female), and a quarter will make it at least to 88/91.
So now that have seen the distribution, let’s consider how long we’ll live past the typical retirement age of 67. The table below lists the ages by sex for the top percentiles given a starting age of 40.
| Top Percentiles - Age at Death | Males | Females |
|---|---|---|
| 5% | 95 | 98 |
| 10% | 93 | 95 |
| 20% | 89 | 92 |
| 30% | 86 | 90 |
| 40% | 84 | 87 |
| 50% | 81 | 85 |
We see that 40% of females and 30% of males are expected to live at least 20 years past retirement age. A little more than 5% of females will make it thirty years past retirement, but only 2.5% of males will. While only a small minority of retirees will need to fund their retirement for thirty or more years, it is not unreasonable to target retirement funds to last until we reach age 90.
Unfortunately, a large share of Americans have insufficient 401k balances to cover their expected longevity (see here, here, and here for some estimates of savings by age group). Many are likely relying on social security benefits to cover some of the difference. This system may not last that long, or at least not with current benefit levels. Social Security outlays have exceeded allocated revenues since 2010 and are currently expected to continue to do so well into the 2090s (see Table A-1). Social security trust fund balances for old-age and survivor benefits are rapidly declining. Between 2020 and 2030, the CBO expects a drop of 80% in this fund. Curiously, over the same time period the trust fund for military personnel is expected to grow by more than 70%, while the fund for civilian government employees is expected to grow by more than 20% (see CBO report). As such, younger Americans not working for the government will need to consider how to fund a multi-decade retirement in the face of potentially large reductions in social security benefits.